/product/{orgId}/tracked-prompts to view and manage your tracked prompts.
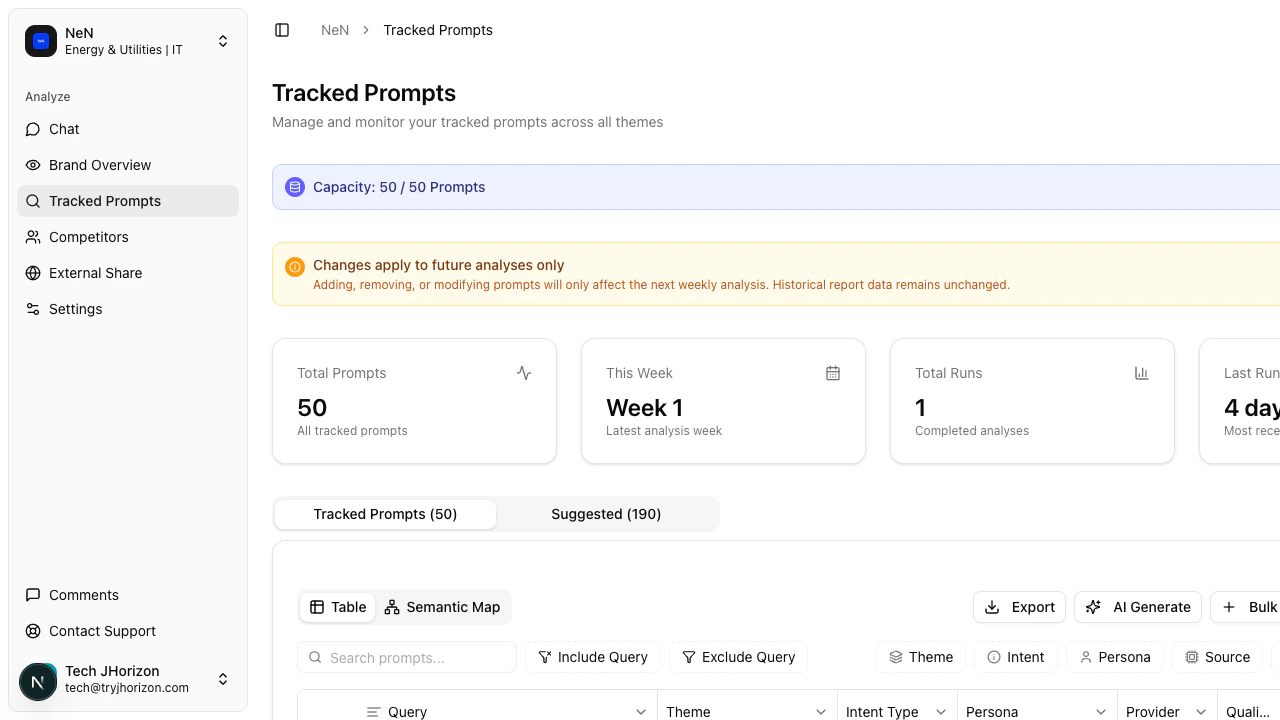
Capacity
The capacity bar at the top of the page shows how many prompts you are tracking out of your plan limit (e.g., 4/50). The bar fills as you approach capacity.KPI cards
Four summary cards give you a quick overview:Total Prompts
The number of prompts currently being tracked.
This Week
New prompts added in the current week.
Total Runs
The total number of analysis executions across all tracked prompts.
Last Run
Timestamp of the most recent analysis run.
View modes
Switch between two ways to explore your tracked prompts:Table view
A list of all tracked prompts with their associated metrics. Filter the list by:- Theme — the topic area of the prompt
- Intent — the user intent behind the query
- Persona — the target audience or persona
- Source — the AI search engine being monitored
Semantic map view
The semantic map plots your tracked prompts in a two-dimensional space based on their meaning. Prompts that ask about similar topics appear close together, while prompts on different topics are spaced further apart. Reading the map:- Clusters — Groups of dots close together represent prompts covering the same topic area. If a cluster is large, you have deep coverage in that area.
- Isolated dots — Prompts far from any cluster cover unique topics. These represent niche coverage that other prompts do not overlap with.
- Gaps — Empty areas between clusters indicate topic areas where you have no tracked prompts. Consider adding prompts to fill these gaps.
- Similarity slider — Drag the slider to adjust clustering sensitivity. Move it left to loosen clusters (more, smaller groups) or right to tighten them (fewer, larger groups). Start in the middle and adjust based on what you want to see.
- Color by — Use the dropdown to color dots by Intent Type, Theme, or other dimensions. This helps visualize how different categories distribute across the semantic space.
- Zoom and fullscreen — Use the zoom controls to focus on specific areas, or click the fullscreen button for a larger view.
- Hover — Hover over any dot to see the full prompt text.
- Click — Click a prompt to view its metrics and details.
Related pages
- Manage prompts — add, remove, and generate prompts
- Suggested prompts — browse AI-recommended prompts