Navigate to external reports
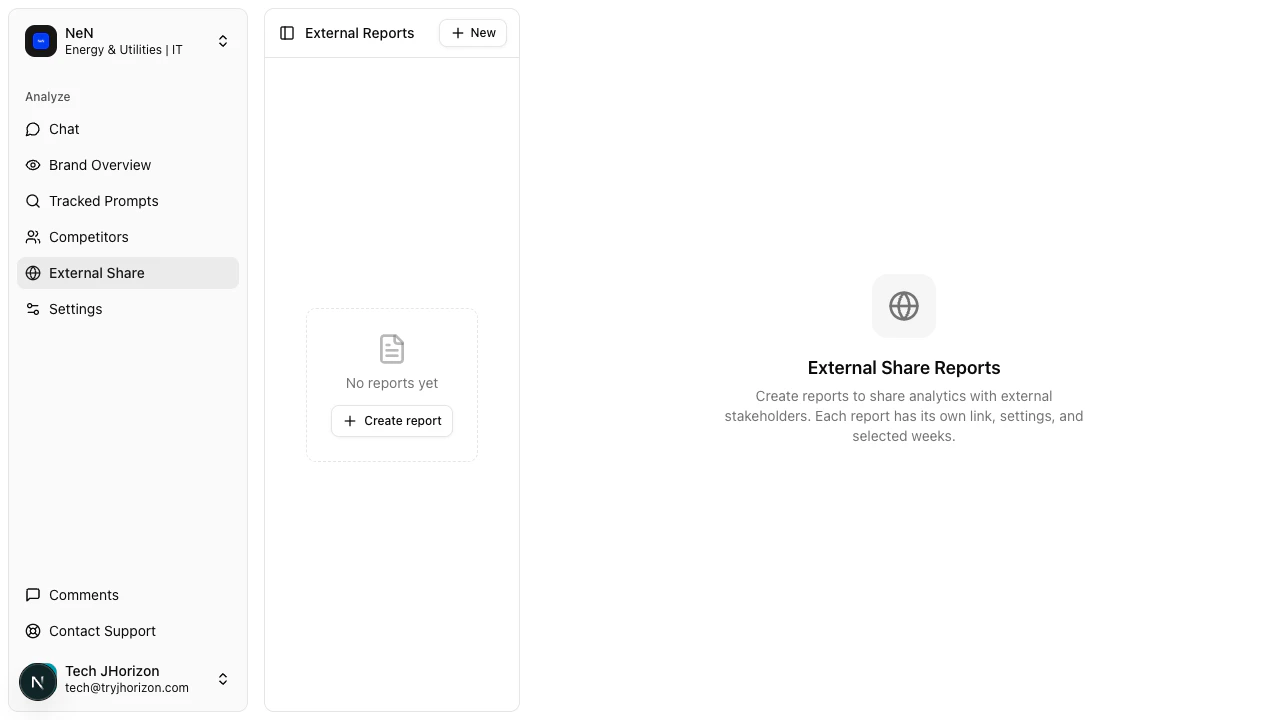
Go to/product/{orgId}/external-share to view and manage all reports for the selected organization. The page uses a split-panel layout: the left panel lists all your reports, and the right panel shows the selected report’s content, settings, and viewer data.
Create a report
1
Start a new report
Click + New at the top of the report list panel, or click Create Report if no reports exist yet.
2
Name the report
Enter a descriptive name for the report.
3
Configure content
Select the analysis weeks and data to include in the report.
4
Share the link
A unique shareable URL is generated. Copy and send it to your stakeholders.
Report features
Report tabs
Each report has three tabs for managing different aspects of the shared report.Content tab
The Content tab shows a preview of what external stakeholders see when they open the report link. Use this to verify the report looks correct before sharing. The preview includes all charts, KPIs, and data from the selected analysis period.Settings tab
The Settings tab controls the report configuration:- Report name — Edit the name displayed at the top of the report.
- LIVE toggle — When enabled, the report updates automatically each time a new analysis run completes. When disabled, the report freezes at the last available analysis snapshot. Use LIVE for ongoing stakeholder reporting and static for point-in-time presentations.
- Analysis weeks — Select which analysis periods to include in the report.
- AI Summary — Click Generate AI Summary to create an AI-written overview of the report data. The summary highlights key metrics, trends, and notable changes. You can regenerate the summary at any time to reflect updated data.
- Team Notes — Add internal notes that are visible only to your team members. External viewers do not see team notes. Use these to provide context, flag areas of concern, or document next steps for your team.
Viewers tab
The Viewers tab tracks report access:- View count — The total number of times the report link has been opened.
- Viewer details — When available, shows information about who accessed the report.
Delete a report
To delete a report, select it in the report list and use the delete option. Deleting a report deactivates the shareable URL — anyone who visits the link after deletion sees an error page.Troubleshooting
Report shows no data
Report shows no data
The organization may not have a completed analysis run for the selected period. Check the dashboard to verify that analysis data exists. If the dashboard has data but the report is empty, try selecting a different analysis week in the report settings.
LIVE report is not updating
LIVE report is not updating
LIVE reports update after each completed analysis run. If your most recent run has not finished, the report still shows the previous period’s data. Check the “Last Run” indicator on the tracked prompts page to see when the last analysis completed.
Stakeholders cannot access the report
Stakeholders cannot access the report
Verify the report link is correct and has not been modified. The link must include the full URL. If the link is correct but access fails, the report may have been deleted or the organization may have been archived.
Related pages
- Collaborative commenting — annotate dashboards with your team